How OpenTelemetry Works?
For a system to be observable, it must be instrumented: that is, code from the system's components must emit signals, such as traces, metrics, and logs.
Using OpenTelemetry, you can instrument your code in two primary ways:
- Zero-code solutions are great for getting started, or when you can't modify the application you need to get telemetry out of.
- Code-based solutions via official APIs and SDKs for most languages. This acts as an essential complement to the telemetry generated by zero-code solutions.

See Instrumentation for more details.
Core Concepts
Resource
a Resource represents the entity that produces telemetry data. It provides metadata such as service name, version, host, or cloud environment, giving context about who emitted the signals. Without it, traces, metrics, and logs lack the identity needed for meaningful analysis.
Signals
Signals are system outputs that describe the underlying activity of the operating system and applications running on a platform. It includes three primary types: logs, metrics, and traces.
Span
A span represents a unit of work or operation. Spans are the building blocks of Traces.
Traces
Traces give us the big picture of what happens when a request is made to an application. One way to think of Traces is that they're a collection of structured logs with context, correlation, hierarchy, and more baked in.
Here is an example Trace made up of 6 Spans:
Causal relationships between Spans in a single Trace

        [Span A]  ←←←(the root span)
            |
     +------+------+
     |             |
 [Span B]      [Span C] ←←←(Span C is a `child` of Span A)
     |             |
 [Span D]      +---+-------+
               |           |
           [Span E]    [Span F]
Here is a temporal view of the same Trace:
Temporal relationships between Spans in a single Trace

––|–––––––|–––––––|–––––––|–––––––|–––––––|–––––––|–––––––|–> time

 [Span A···················································]
   [Span B··········································]
      [Span D······································]
    [Span C····················································]
         [Span E·······]        [Span F··]
Metrics
A metric is a measurement of a service captured at runtime. The moment of capturing a measurement is known as a metric event
+------------------+
| MeterProvider    |                 +-----------------+             +--------------+
|   Meter A        | Measurements... |                 | Metrics...  |              |
|     Instrument X +-----------------> In-memory state +-------------> MetricReader |
|     Instrument Y |                 |                 |             |              |
|   Meter B        |                 +-----------------+             +--------------+
|     Instrument Z |
|     ...          |                 +-----------------+             +--------------+
|     ...          | Measurements... |                 | Metrics...  |              |
|     ...          +-----------------> In-memory state +-------------> MetricReader |
|     ...          |                 |                 |             |              |
|     ...          |                 +-----------------+             +--------------+
+------------------+
Logs
A log is a timestamped text record, either structured (recommended) or unstructured, with optional metadata. OpenTelemetry's support for logs is designed to be fully compatible with what you already have, providing capabilities to wrap those logs with additional context and a common toolkit to parse and manipulate logs into a common format across many different sources.
Baggage
Baggage is often used in tracing to propagate additional data across services. Additionally, instrumentations automatically propagate baggage for you. Baggage is best used to include information typically available only at the start of a request further downstream (Account ID, User ID, Product ID, origin IPs, etc.)


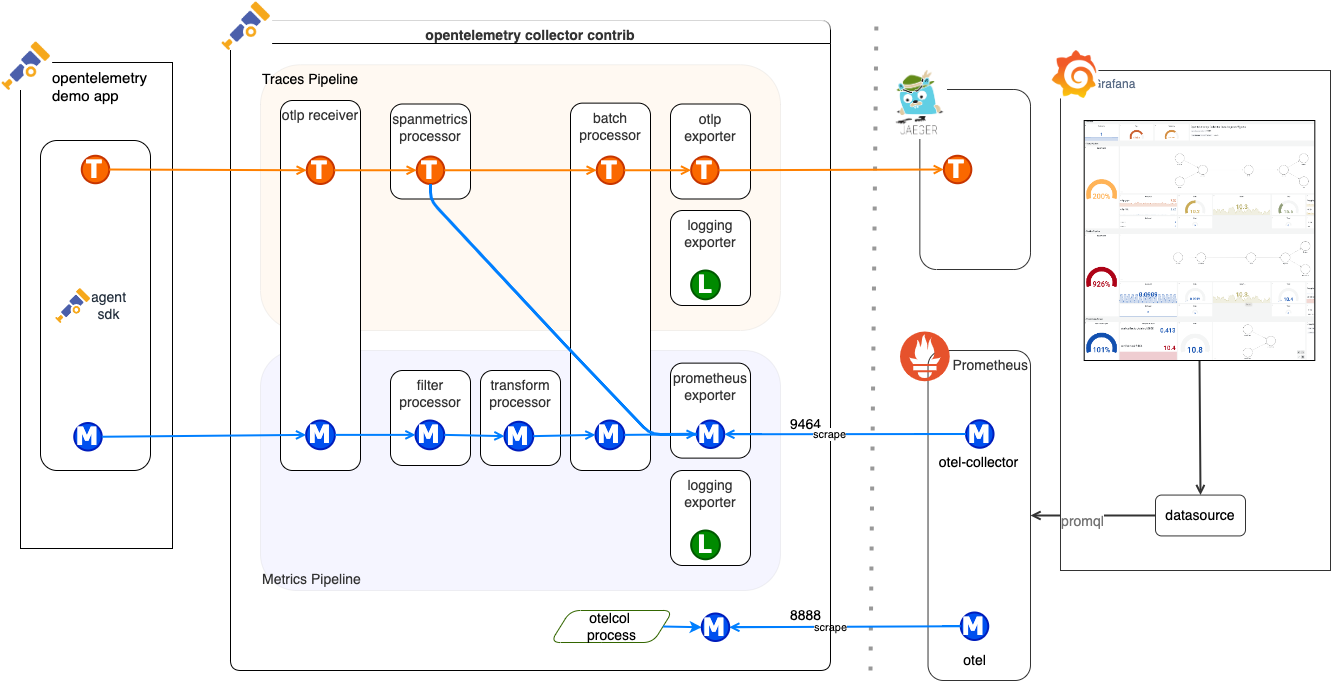
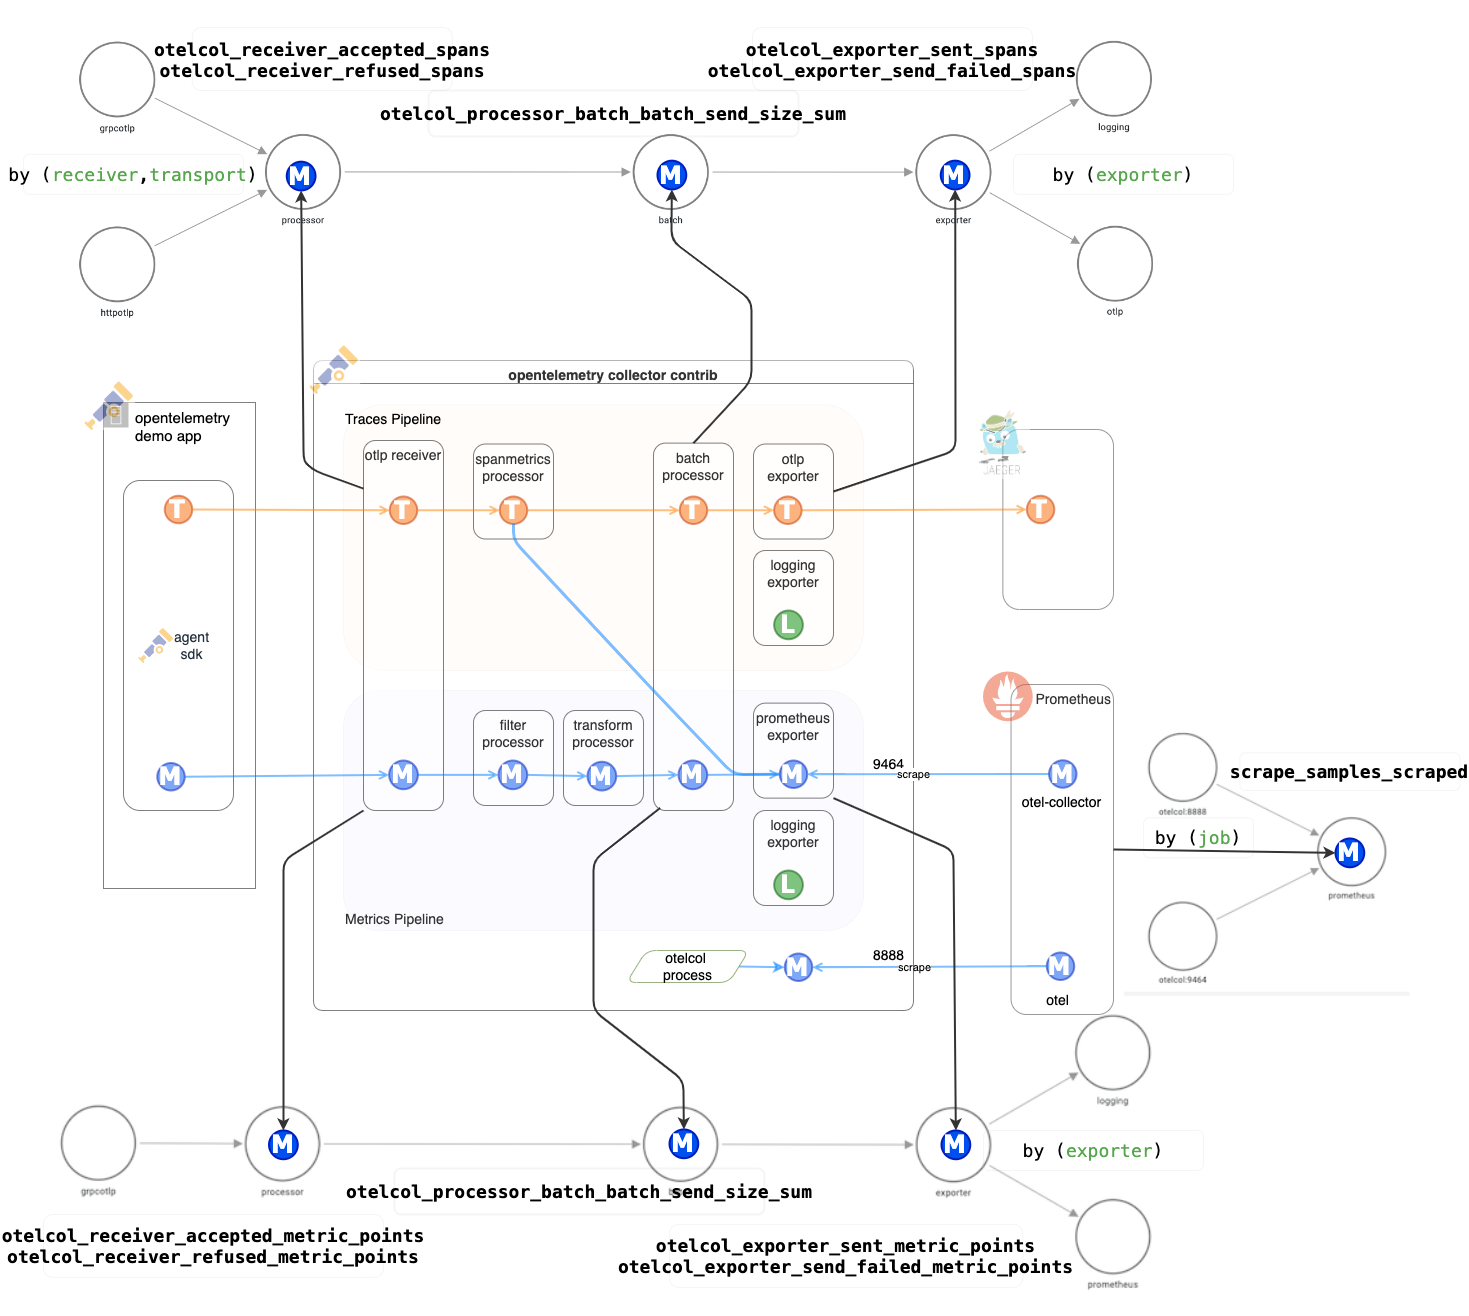
Architecture Components
- Specification: API, SDK, and Data (OLTP, Semantic Conventions)
- Collector (a vendor-agnostic way to receive, process and export telemetry data.)
- Receivers
- Processors
- Connectors
- Exporters
- Language-specific API & SDK implementations
- Kubernetes operator
- Function as a Service assets